PySeisTuned
PySeisTuned2.0 is a Flask web app that allows users to produce seismic tuning wedge forward models (more on that ![]() ). Originally, I built PySeisTuned as a GUI application using Python 3 and PyQT5 because I wanted to deploy code from a Jupyter Notebook into something re-usable with minimal end-user configuration. Once I completed that initial version, I realized that deploying the software as a web app would make it even more accessible. This led me to learn Flask as it seemed like a lightweight framework perfectly suited for a simple web app. Instead of using PyQT5 widgets to build the GUI, the web app version uses HTML & Bootstrap CSS along with some custom CSS and a little JavaScript. I previously had experience building a static web page with HTML and CSS when I built a web site for my advisor’s research group AASPI while in graduate school (10 years ago now!). Building PySeisTuned2.0 was a nice refresher with HTML and CSS.
). Originally, I built PySeisTuned as a GUI application using Python 3 and PyQT5 because I wanted to deploy code from a Jupyter Notebook into something re-usable with minimal end-user configuration. Once I completed that initial version, I realized that deploying the software as a web app would make it even more accessible. This led me to learn Flask as it seemed like a lightweight framework perfectly suited for a simple web app. Instead of using PyQT5 widgets to build the GUI, the web app version uses HTML & Bootstrap CSS along with some custom CSS and a little JavaScript. I previously had experience building a static web page with HTML and CSS when I built a web site for my advisor’s research group AASPI while in graduate school (10 years ago now!). Building PySeisTuned2.0 was a nice refresher with HTML and CSS.
Aside from the rather obvious changes in moving from PyQT to Flask, HTML, and Bootstrap CSS, another change I implemented in building PySeisTuned2.0 is that I opted to use Bokeh for plotting over Matplotlib. This decision allows user interaction with output plots which I think better fits a web app. Something I intended to add to the original GUI version of PySeisTuned was an in-depth about page providing background theory. Moving to a Flask web app made this much easier to implement by simply creating a route to an ‘about’ page. Additionally, I created a ‘contact’ page with a simple Flask form. Both version of PySeisTuned are OSS with source code available on my GitHub.
Once I was done building PySeisTuned2.0, I needed to find a way to deploy the web app. After evaluating several options I decided to use DigitalOcean’s Basic Droplet offering. The DO Basic Droplet is their virtual machine base offering and is very cost effective at $5 per month. I secured my custom domain name on namecheap.com and pointed it to DO’s name-servers. While DO has several options which simplify deploying, such as the App Platform, I chose to go a more traditional route of setting up an Ubuntu server, configuring ssh password-less login, installing dependencies, setting up gunicorn and supervisor for the production web server, and configuring nginx with Let’s Encrypt for HTTPS. ![]() I have no affiliation with either DigitalOcean or Namecheap and get nothing from sharing their links here. I have been happy with my experience using both and want to share what has worked well for me
I have no affiliation with either DigitalOcean or Namecheap and get nothing from sharing their links here. I have been happy with my experience using both and want to share what has worked well for me
And now for something completely different 
Tuning wedges are a basic geophysical tool for understanding how layer thickness variations impact seismic amplitude. As a subsurface layer thins, the seismic reflections from the top and bottom interface of the layer begin to constructively interfere with one another. At a certain point, this constructive interference, and therefore reflection amplitude strength, reaches a maximum and is termed the tuning thickness. The tuning thickness is a very important concept in geophysics because it is the minimum thickness for which the top and bottom interfaces of a layer can be fully seismically resolved. Below the tuning thickness, amplitude strength rapidly decays and eventually the layer will become seismically invisible, meaning that it is too thin to generate a seismic reflection. In between tuning thickness and the point at which the layer is no longer resolvable, seismic will actually overestimate layer thickness.
Here’s what a wedge model looks like:
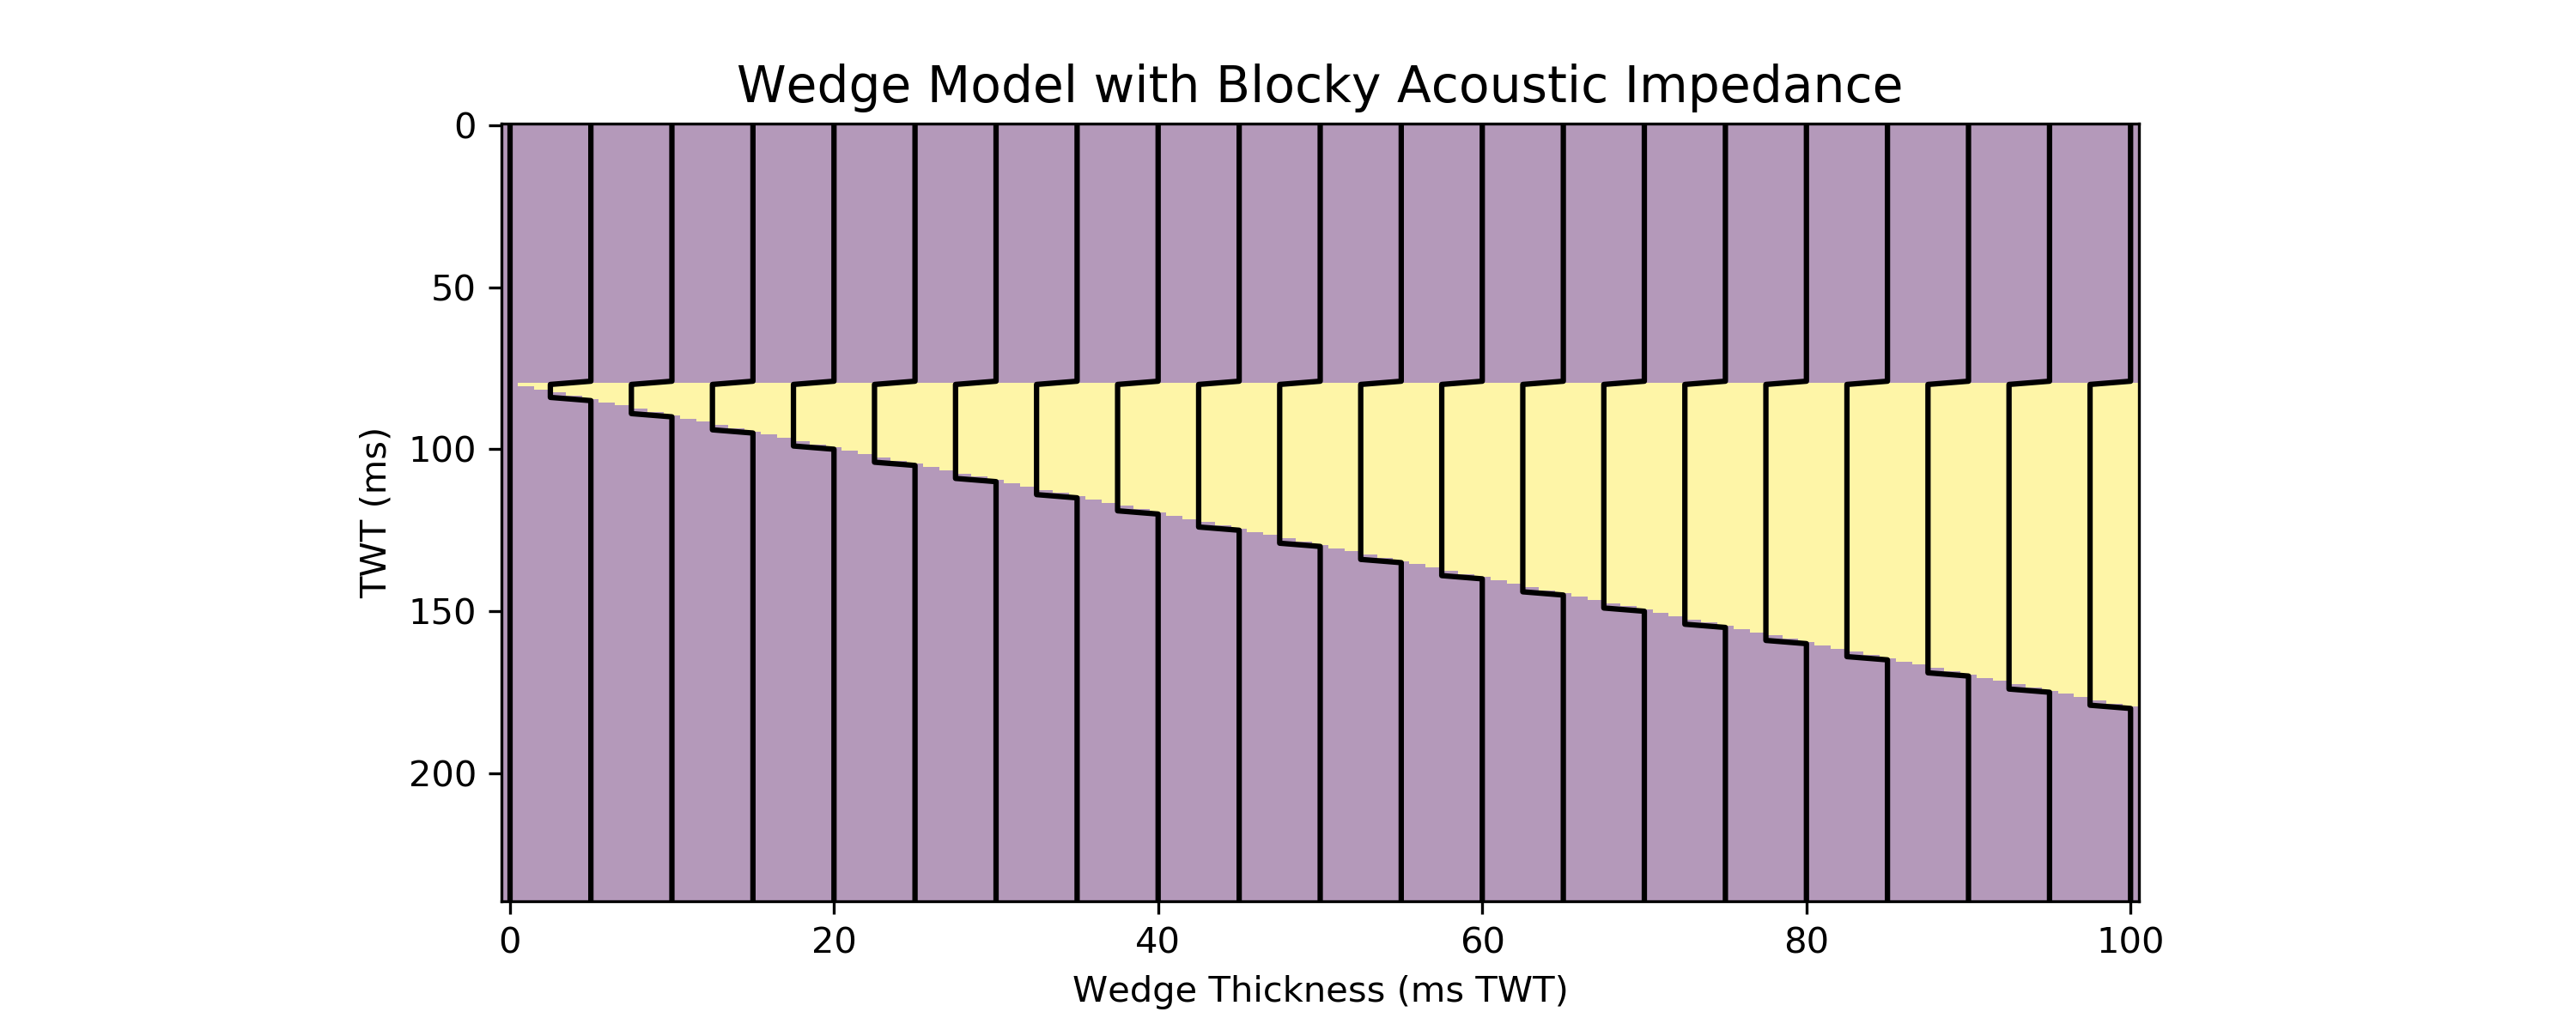
The upper and lower layers have the same elastic properties, while the middle wedge layer is different. The overlay traces show the Acoustic Impedance of each layer and is a function of velocity and density. This wedge model is convolved with a wavelet to produce the synthetic tuning wedge:
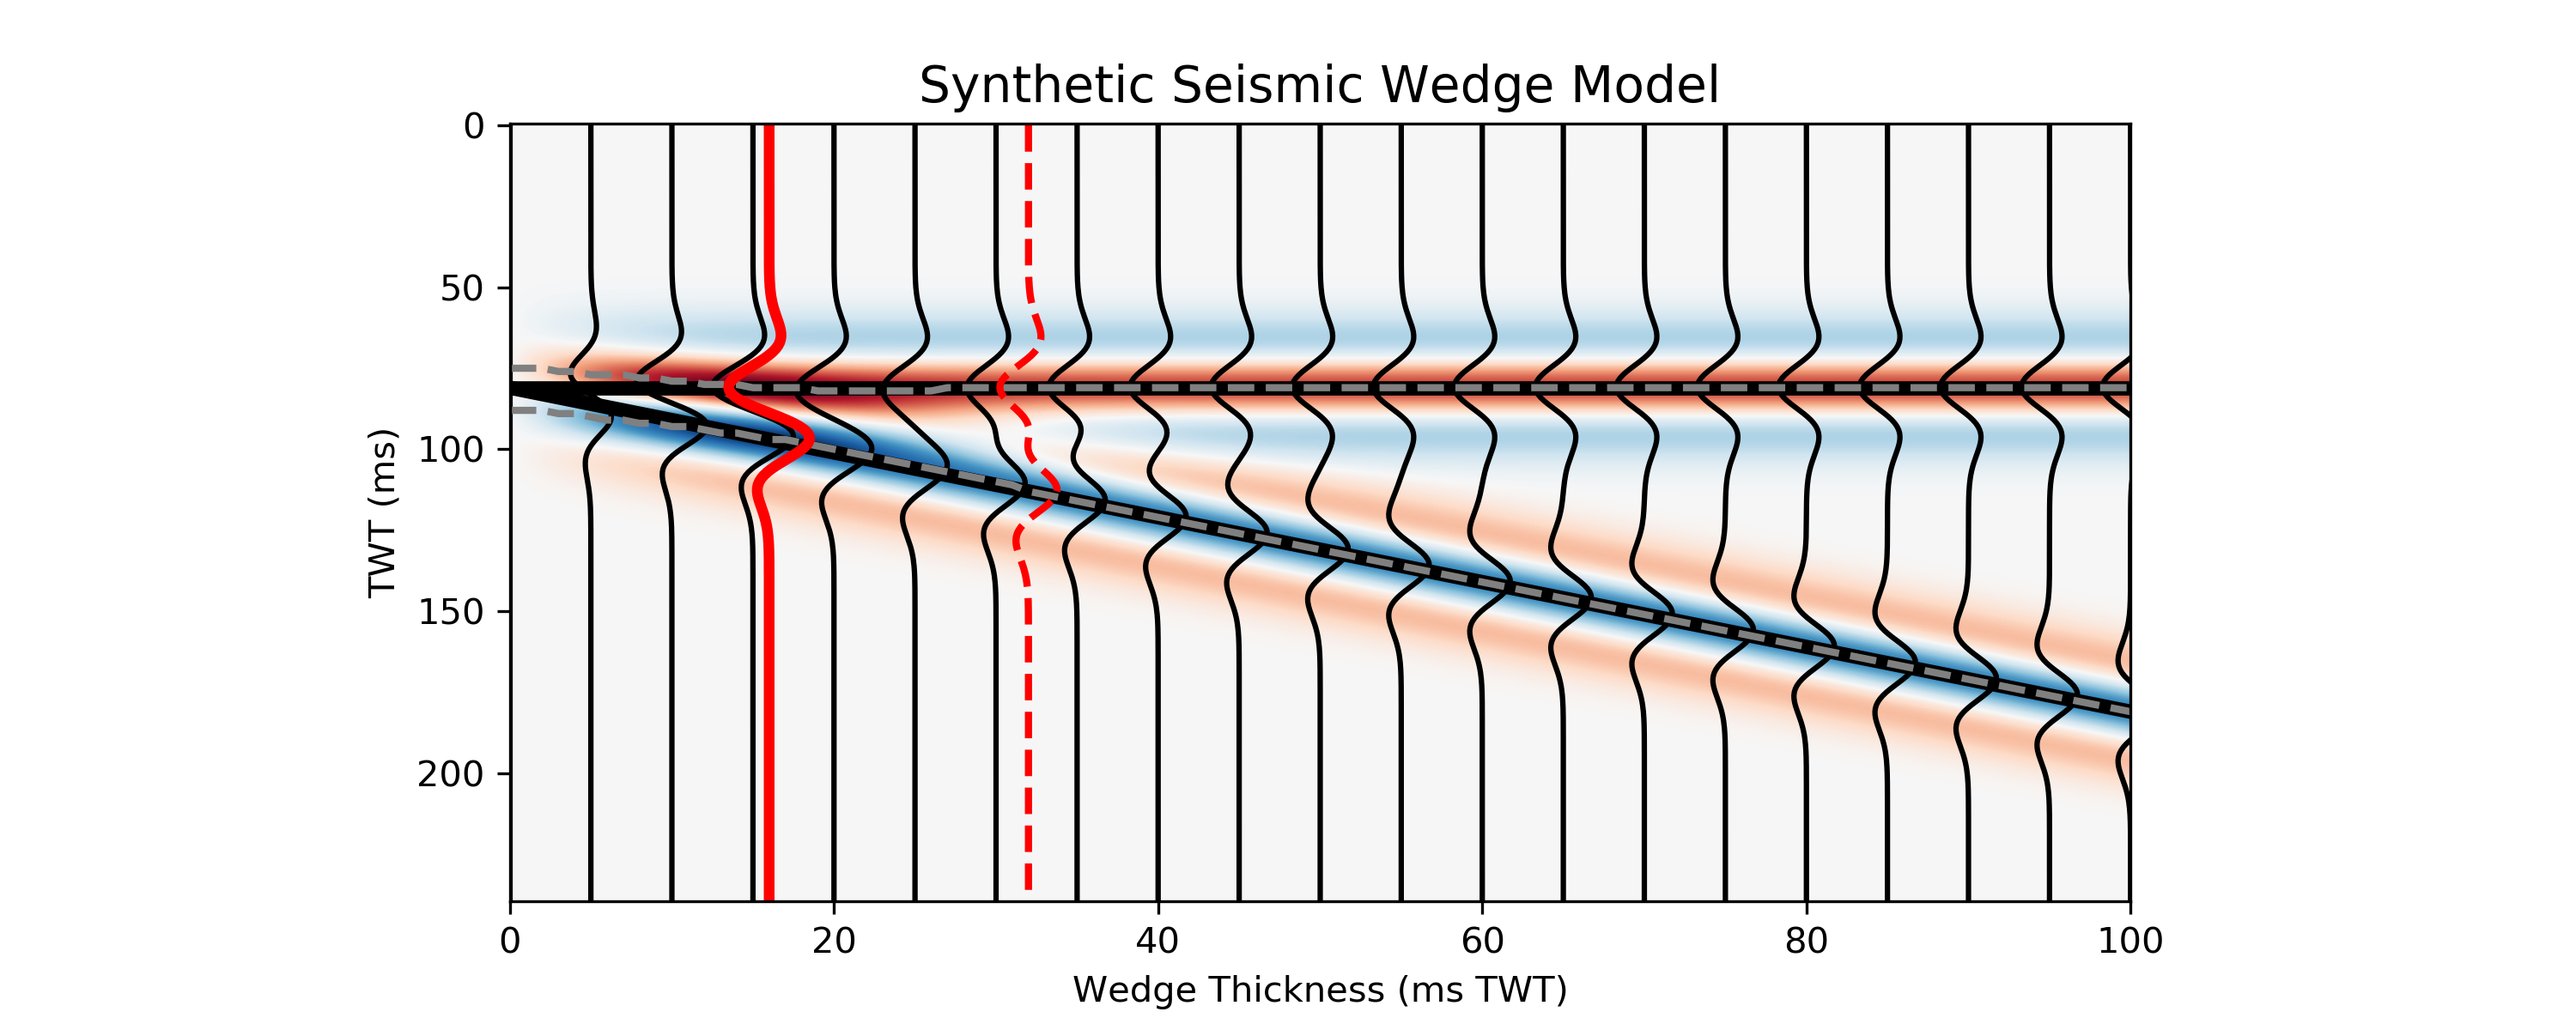
Now, we see the seismic representation of the wedge model. Notice that this representation focuses on the interfaces between the two layers instead of the actual layers, represented by the solid black lines. The dashed gray lines represent the apparent thickness when mapping the maximum peak and minimum trough time. The solid red trace is at the tuning thickness, while the dashed red trace is at the onset of tuning which is the layer thickness when constructive interference begins. In between the onset of tuning and tuning thickness, the apparent thickness is less than the actual thickness. Below tuning thickness, apparent thickness is larger than the actual thickness. This phenomenon makes it challenging to interpret true stratigraphic limits of a layer.
Finally, here is a tuning curve:
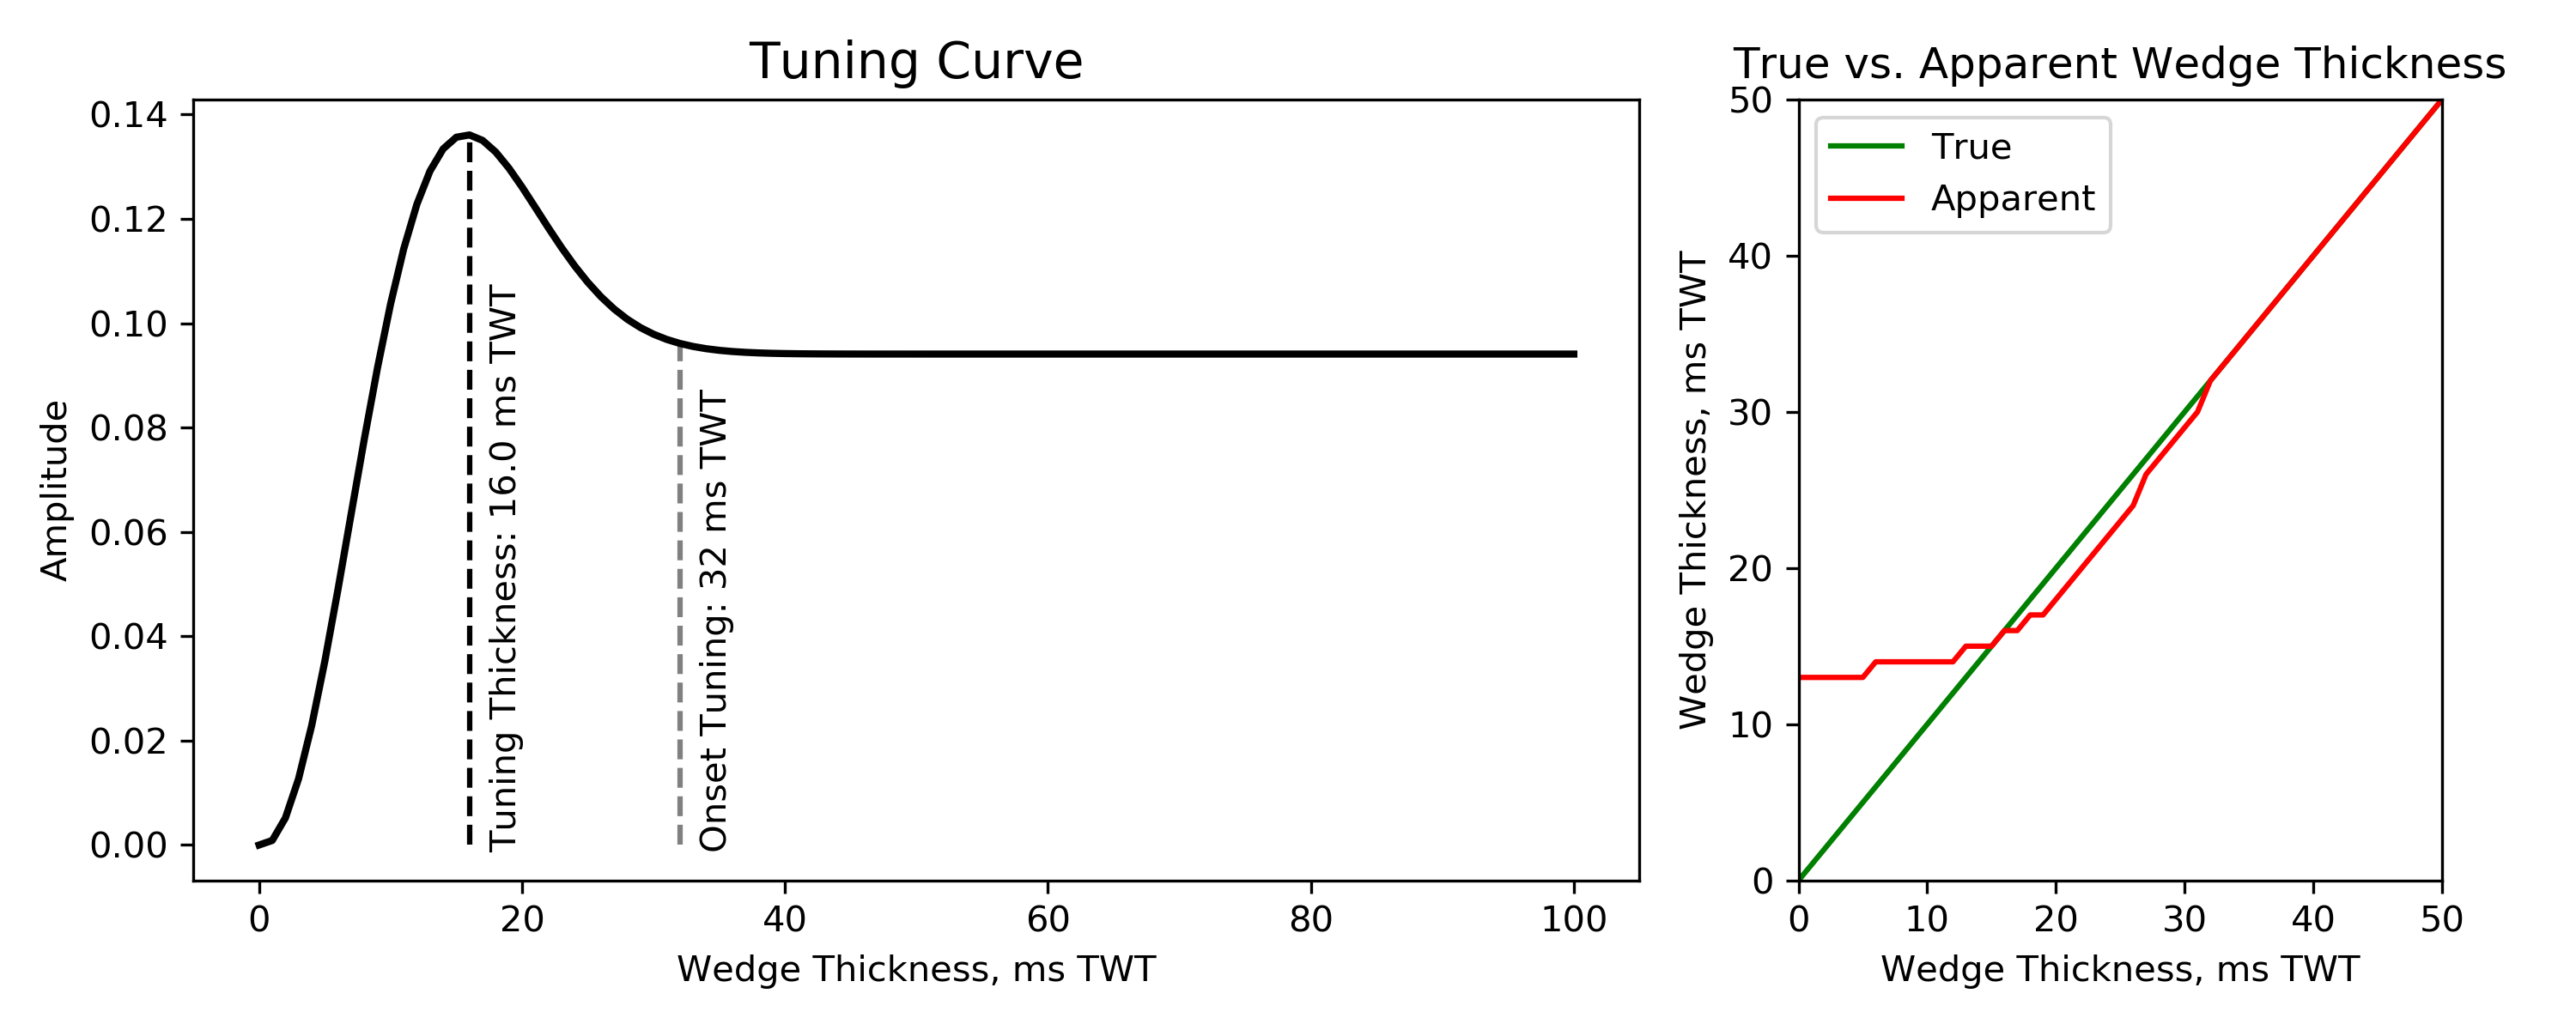
The tuning curve is a plot of the amplitude when measured at the top of the wedge model and is a graphical representation of how amplitude varies with layer thickness.
For more detailed description about tuning theory and wedge models, visit the PySeisTuned2.0 About page.